Dear NEON Project partners, our project on 14th January is officially over, and now we are entering the final reporting phase. First of all, thank you so much to each and every one of you for your valuable contribution and cooperation!
Project Website Activity Report
During project implementation, we posted our events, workshops, meetings, and announcements using the NEON Project website. To highlight what level of visibility we have achieved, we prepared a report on the website activity. The activity tracking by Google Analytics was started on 3rd November 2022, and the presented data includes statistics between 3rd November 2022 and 15th January 2024.
Visits, Views and Users:
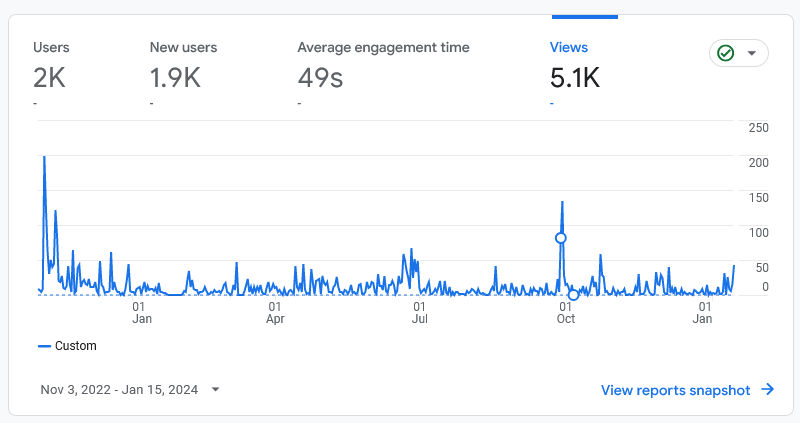
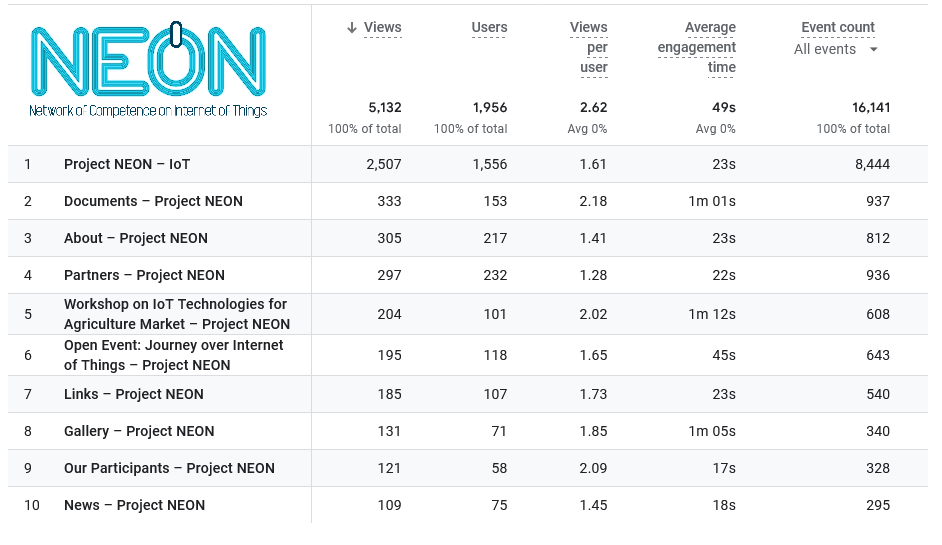
The total number of unique users during the tracking period reached 1957. These users visited the website 5132 times. The most visited page is the main page, which gained 2507 views or 49%. Despite the video content available on the main page, users tend to spend only 23 seconds on it, compared to the average session time of 49 seconds. Interestingly, the Documents section, the post about the Workshop on IoT technologies for the Agriculture market, and the Gallery are the most engaging pages, with an average engagement time of over 1 minute.
User Geography and Activity:
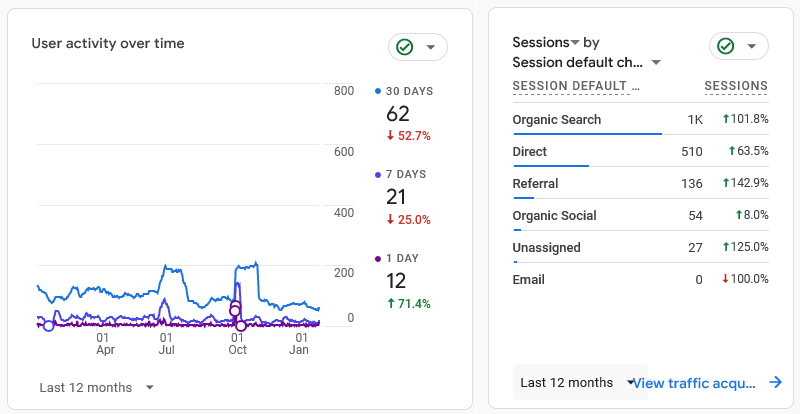
Analyzing user activity over the last 12 months, there are two distinct peaks in user activity at the beginning of July and October. The first peak of the activity highly correlates with the Workshop on IoT Technologies for Agriculture Market and Project Meeting in Cordoba. The second increase in user activity was most likely caused by the open event “Journey over Internet of Things”.
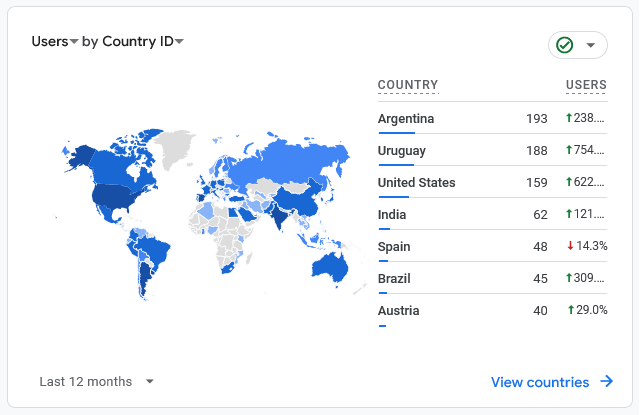
The geography of users is quite versatile. The most users came from Argentina (193) and Uruguay (188), which was quite expected. However, most surprisingly, many users also came from the United States (159), where Project NEON has neither partners nor target groups. The United States in terms of user activity leaves two other partner countries, Spain (48) and Austria (40), well behind.
